Network Analysis
You’ll recognize Kumu’s powerful relationship mapping technology on the Network Analysis page. Network Analysis is accessible to everyone in the community and allows for deeper analyis of the structure and strength of your community.
To access, click on the menu icon in the top-left corner of your screen, and choose "Network Analysis".
Functionalities
The Network Analysis page is packed with powerful functionalities that allow you to analyze your community by both qualitative and quantitative data. Use any or all of the below functionalities to discover the hidden structures in your community and/or find potential ways to grow and connect over time. Click on any element in the network to see a quick overview of that community member, or click the link to their profile.
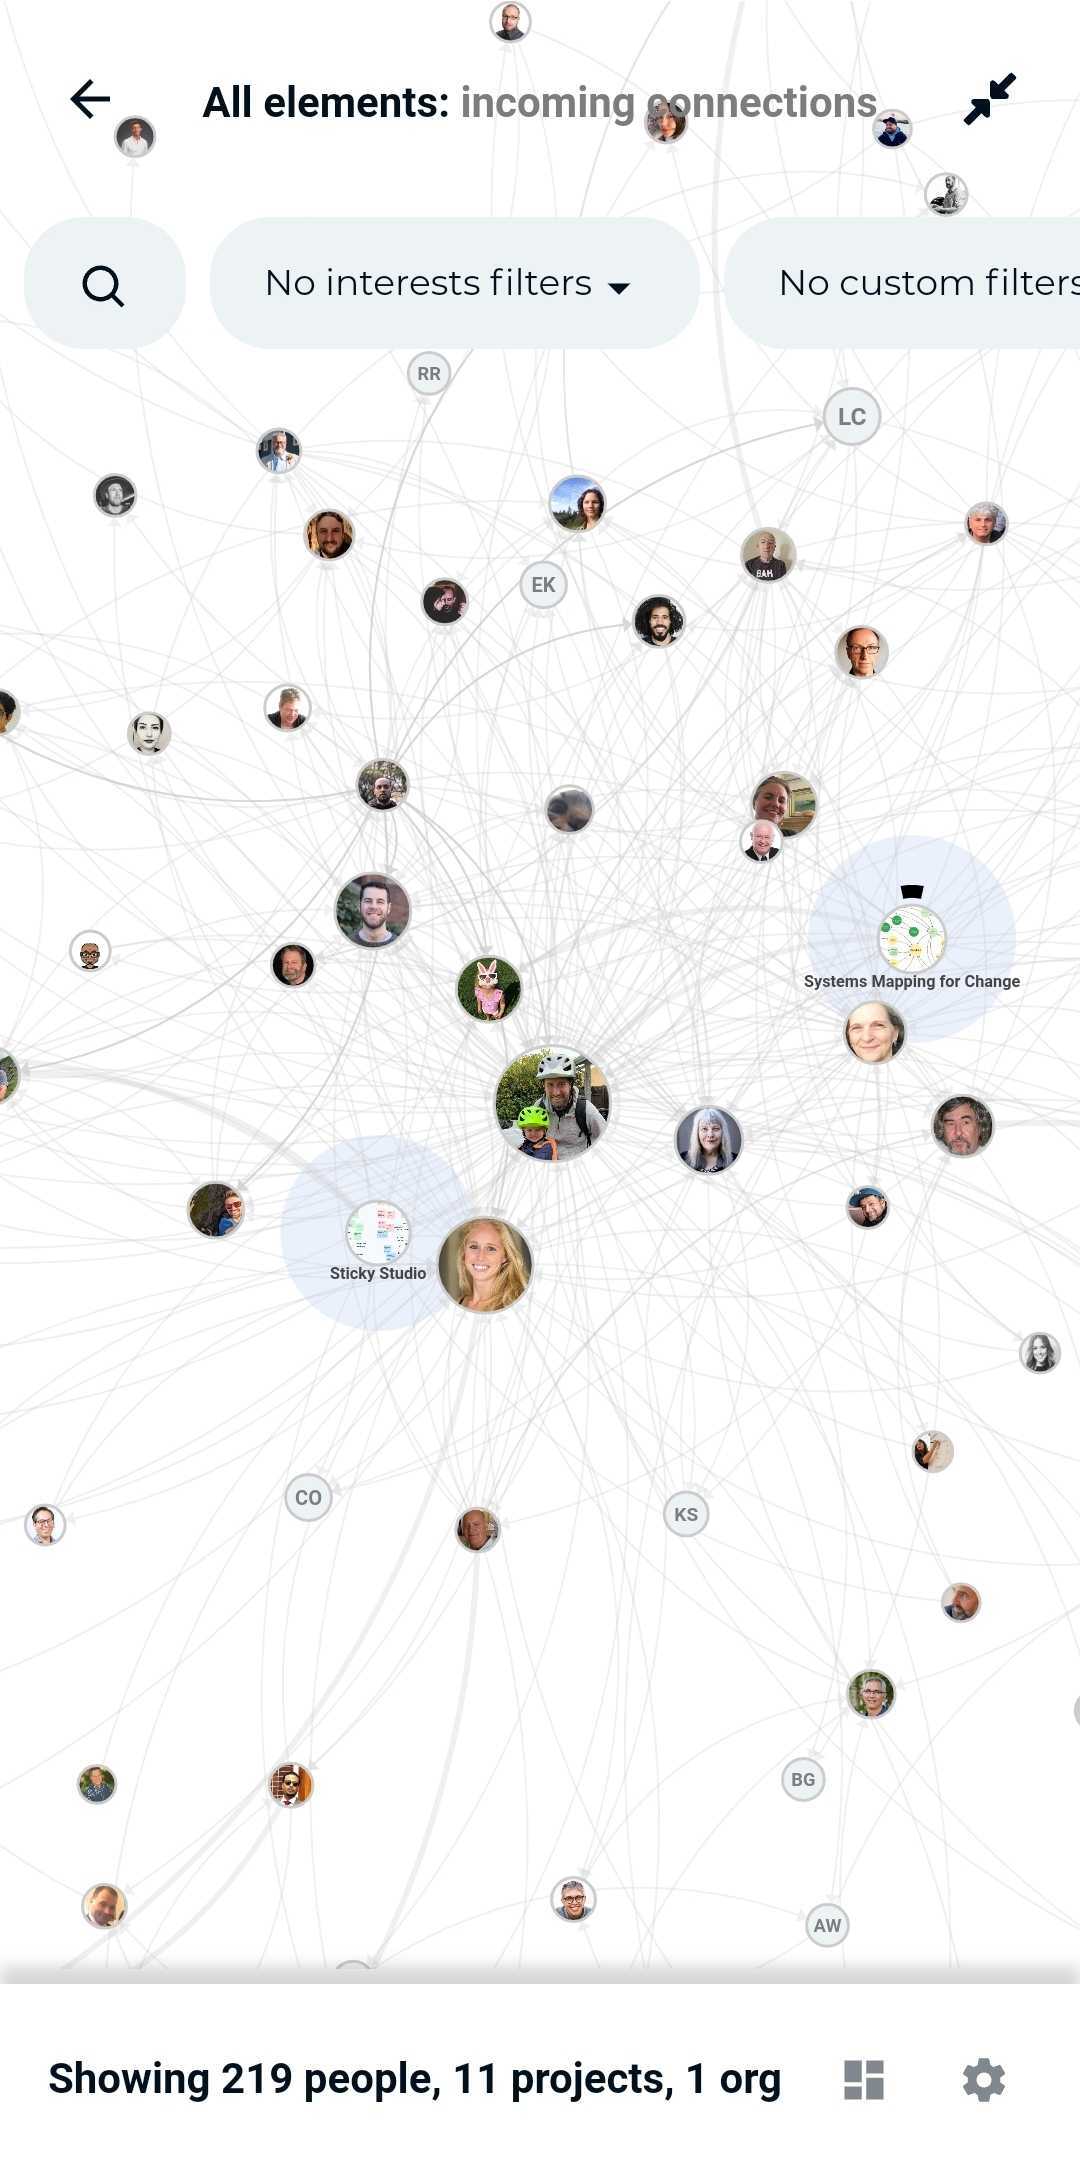
See your community’s relationships and relationship strengths
Each arrow on your network map indicates a relationships between those two members. The strength of the relationships is reflected by the thickness of the connection. As such, you can quickly see which relationships in your community are stronger vs weaker. Swipe right across the filter options and choose "All connections" to choose which relationships you'd like to focus on.
Filter your community
The top of the page shows all the different filters you can use to explore your community network. You can filter based on any of the profile fields, projects, elements and/or connections (relationships). Swipe right at the top to see all filter options.
Include orphans
"Orphans" are community members that aren't connected to anyone in the community, and thus, float around the network map without being part of the community. They are usually placed around the edges of your network map.
Orphans can be a bit distracting or distort your SNA metrics, so you can take them out of the view. Click on the "All Elements" filter and un-check the Include Orphans checkbox.
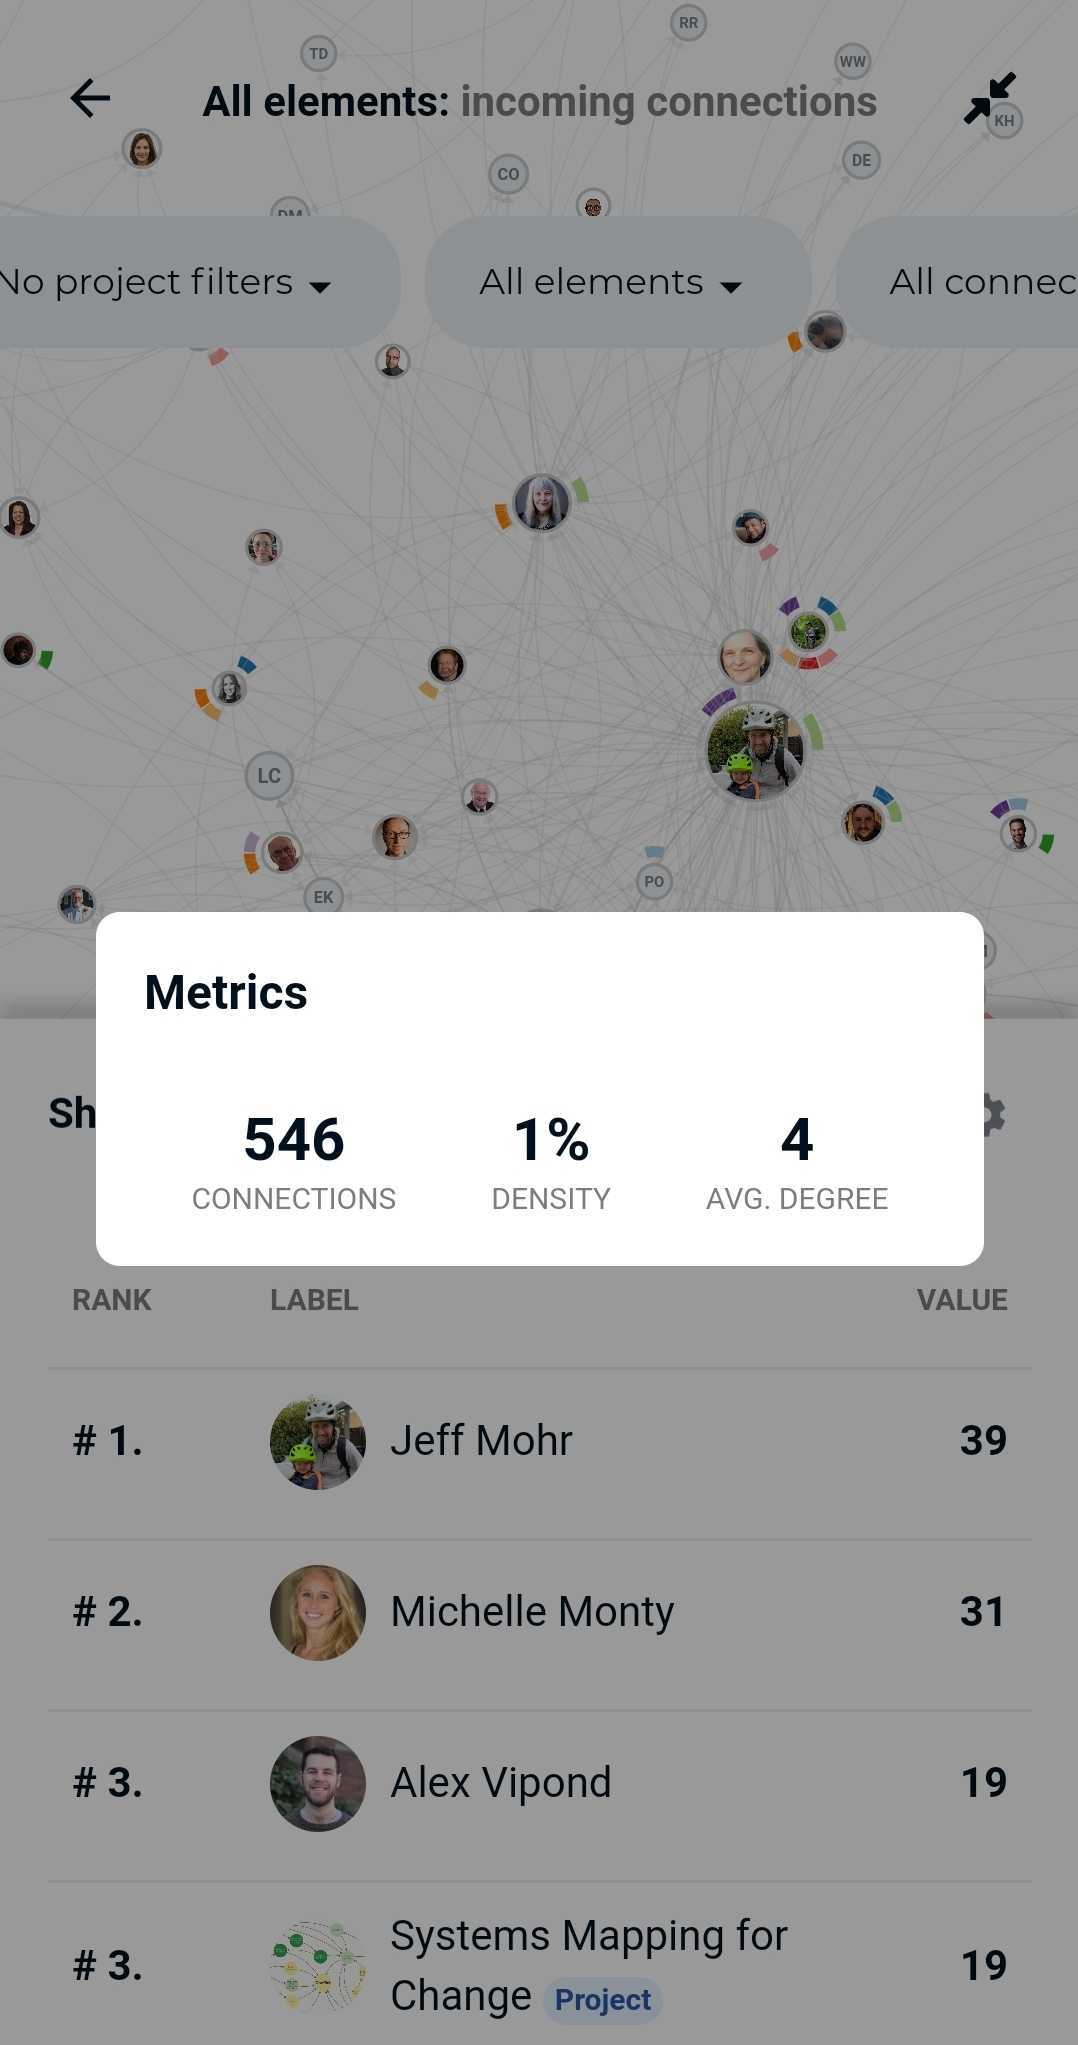
View basic Social Network Analysis (SNA) metrics
Click on the metrics icon in the bottom-right corner to see a quick overview of the following metrics for your community:
- Connections - Indicates the number of connections in your current view
- Density - Density is defined as the number of connections a community member has, divided by the total possible connections a community member could have. For example, if there are 20 community members, each member could potentially connect to 19 other members. In that case, a density of 1 (19/19) is the greatest possible density in the system, where everyone is connected to everyone. A density of 0.05 (1/19) would be the lowest density possible, and indicates that there's much room for improvement in weaving your community!
- Avg. Degree - Degree counts the number of connections an element has, so average degree indicates how many connections the average community member has. In general, members with high degree are the local connectors / hubs, but note that they aren't necessarily the best connected to the wider network.
Note that these metrics are re-calculated for every view. So if you've filtered your network map based on relationships strengths, then your metrics will also update according to the view you're looking at.
To run more advanced SNA metrics with your community data, we recommend to export your Weavr data to Kumu, where you can run many more SNA metrics.
Size elements and rank the community
Click on the Settings icon in the bottom-right corner of the page to choose which metric to size your elements by: Betweenness Centrality, Incoming Connections, Outgoing Connections, or Total Connections. You can find an explanation for each below.
If you click on the menu bar at the bottom of the Network Analysis page where it says "Showing x people, x projects, x org(s)", your community will be ranked based on the chosen SNA metric (Value column). The current options are:
- Betweenness Centrality - Betweenness centrality measures how many times a community member lies on the shortest path between two other community members. In general, members with high betweenness have more control over the flow of information and act as key bridges within the network. However, they can also be potential single points of failure.
- Incoming Connections - Measures the number of incoming connections for a specific community member (also called "indegree"). That is; many people indicated they have a relationships with them. In general, members with high indegree (incoming connections) can be regarded as leaders in a community, looked to by others as a source of advice, expertise, or information.
- Outgoing Connection - Measures the number of outgoing connections for a specific community member (also called "outdegree"). In general, members with high outdegree (outgong connections) have the potential to reach a high number of other elements and spark the flow of information across a network. Nevertheless, they may not be the most efficient at spreading the information, or may report relationships that aren't reciprocated.
- Total Connections - Counts the number of connections a specific community member has (alo called "degree"). In general, members with high degree are the local connectors / hubs, but aren't necessarily the best connected to the wider network.
Looking to do more extensive network analysis? Export your Weavr data to Kumu to use Kumu's more advanced features.
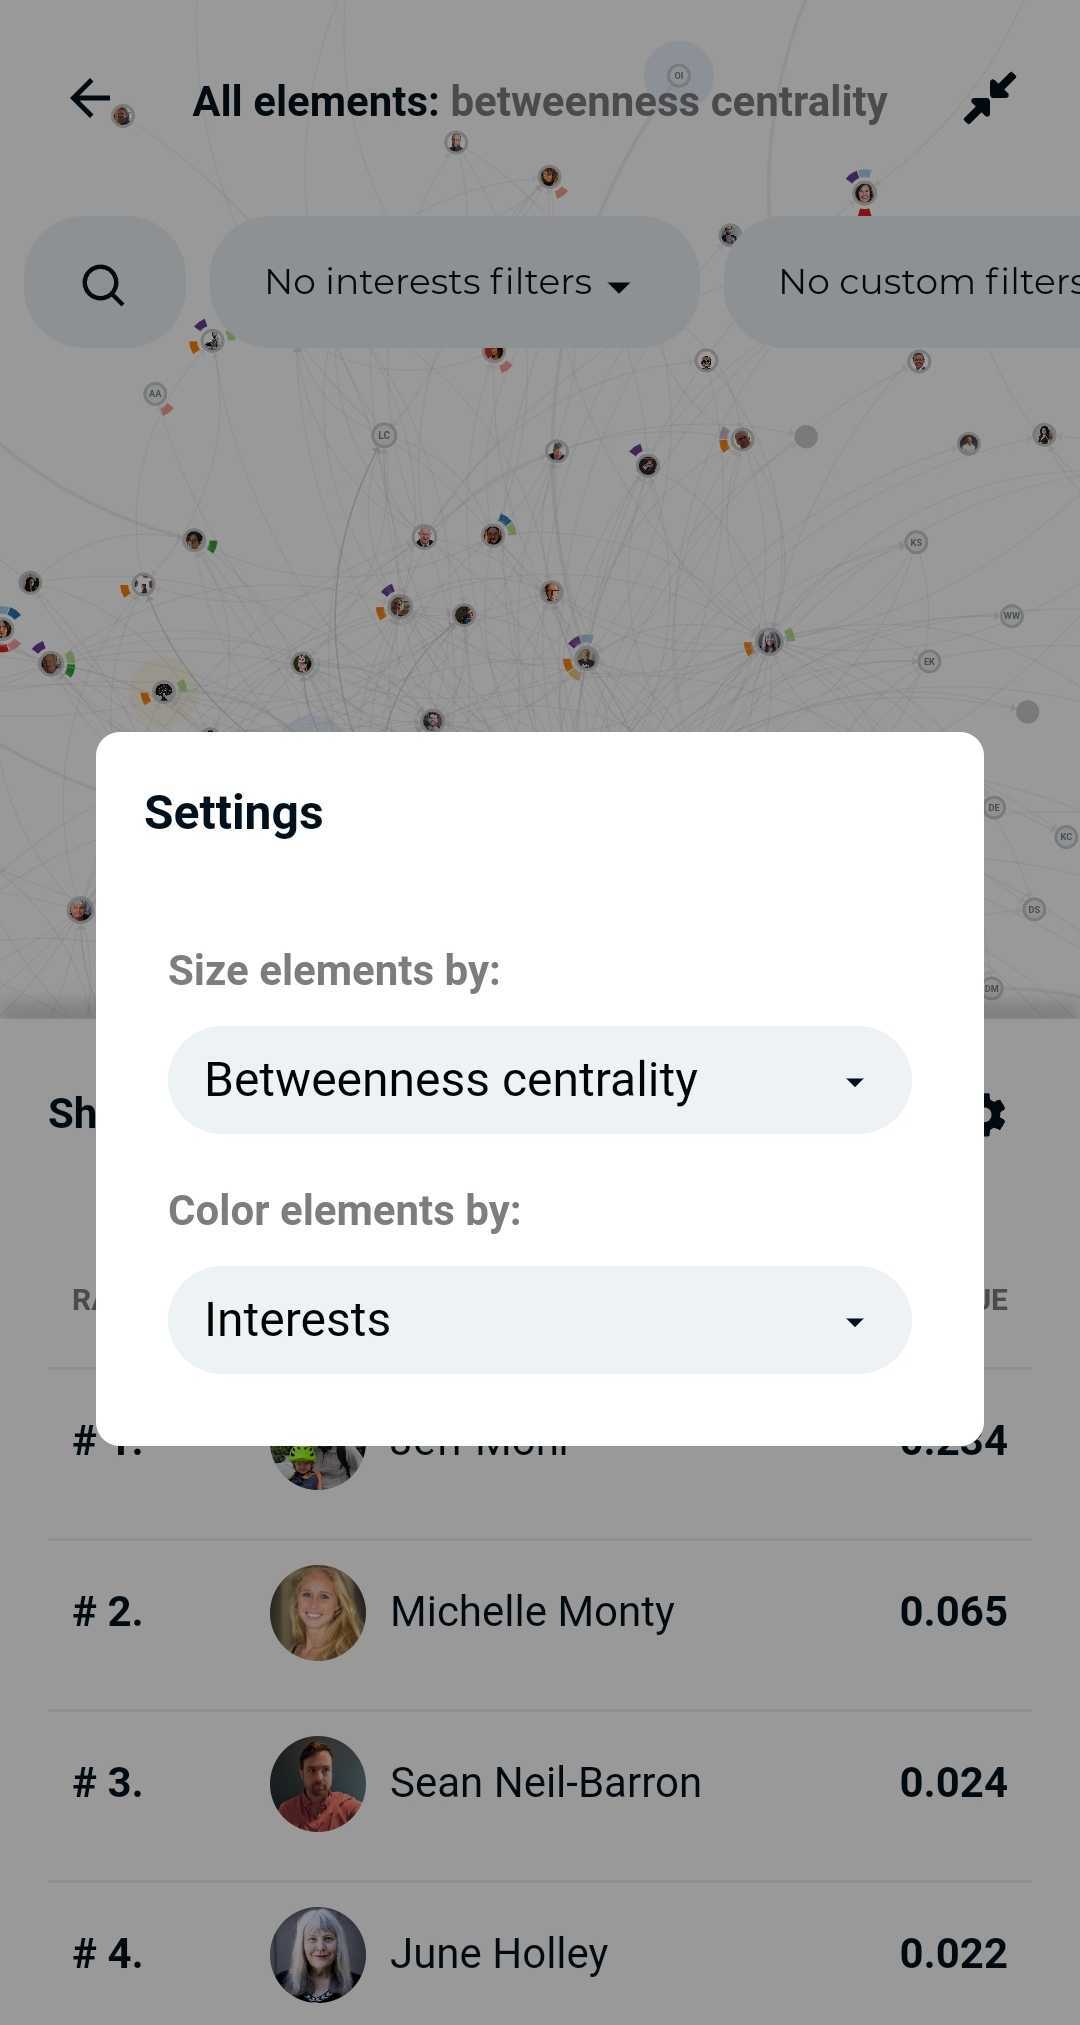
Color elements based on profile fields and add a legend
Click on the Map Settings icon in the bottom-right corner of your screen to further customize your network map. Then, click on the dropdown "Color elements by:" to choose a field to color your map by. Upon choosing the field, a legend will be added in the bottom-left corner of your map. Please note you can only color by one field at a time.
Note: if you can't see the color legend. Make sure to swipe down the moveable ranking screen and click on the arrow next to the word "Legend" in the bottom-left corner to make it appear.